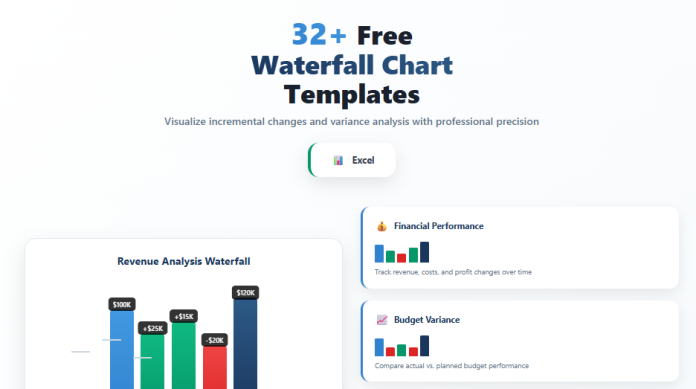
In today’s data-driven world, showing how values increase or decrease step-by-step is more important than just presenting totals. That’s where waterfall charts shine. These dynamic visuals help you communicate complex data movements clearly—whether you’re analyzing profit margins, budgeting trends, or project progress.
To make your reporting easier, we’ve created a curated collection of 32+ free waterfall chart templates in Excel. These templates are fully editable and tailored for finance teams, project managers, business analysts, and anyone who wants to break down their data in a meaningful way.
✔️ What Is a Waterfall Chart?
A waterfall chart is a visual representation of how an initial value is affected by a series of intermediate positive or negative changes, eventually arriving at a final value. It’s often used to:
- Track profit and loss
- Visualize cash flow
- Show budget vs. actual variance
- Present sales funnel movement
- Analyze project cost breakdowns
Each bar in the chart builds upon the last, making it easy to see which elements drove the total up or down.
✔️ Why Use an Excel Waterfall Chart Template?
✅ Save time—skip the formatting hassle
✅ Visually explain value shifts to clients or stakeholders
✅ Identify problem areas or growth drivers quickly
✅ Use Excel’s built-in features with pre-designed formulas
✅ Customize colors, data labels, and categories with ease
These templates help non-technical users quickly turn data into compelling visuals—no coding or advanced charting skills required.
✔️ What’s Inside the 32+ Free Template Collection?
Our Excel waterfall chart templates are designed for different industries, departments, and use cases. Each template includes labeled bars, data columns, and editable ranges.
🟢 Business & Finance Templates
- Revenue and expense breakdown
- Profit margin analysis
- Cash flow waterfall
- EBITDA visualization
- Financial year comparison
🔵 Project Management Templates
- Budget allocation vs. actual spending
- Resource usage over time
- Phase-by-phase cost tracking
- Milestone progress with cost impact
🟣 Sales & Marketing Templates
- Funnel conversion tracking
- Campaign cost-effectiveness breakdown
- Customer acquisition metrics
- Monthly performance waterfall
✔️ How to Use These Waterfall Chart Templates
- Download your preferred template
- Enter your data in the editable columns (starting value, increases, decreases, ending value)
- Excel will auto-update the chart with accurate values
- Customize titles, legends, and color schemes
- Insert the chart into presentations, reports, or dashboards
You can also duplicate templates across sheets for year-over-year or department-by-department comparisons.
✔️ Best Use Cases
☑️ Financial reporting – Present income statements and forecasts
☑️ Stakeholder presentations – Clearly show performance shifts
☑️ Project retrospectives – Track budget and scope changes
☑️ Marketing ROI reviews – Highlight spending efficiency
☑️ Management reviews – Visualize KPIs over time
Whether you’re in the boardroom or prepping internal dashboards, these visuals help tell the story behind your numbers.
✔️ Tips for Effective Waterfall Charts
✅ Use consistent color schemes to indicate positive/negative values
✅ Label each bar for quick reading
✅ Limit data series to the most relevant categories
✅ Always include a clear title and legend
✅ Keep the chart simple—avoid clutter for maximum impact
A good waterfall chart is more than numbers—it’s a visual narrative that helps teams make smarter decisions.
➡️ Download Now and Visualize with Confidence
With these 32+ free waterfall chart templates in Excel, you can turn raw data into impactful visuals that get noticed. From financial statements to project overviews, these tools help you communicate trends, track change, and influence decisions.
👉 Download now and start building visual stories that move your business forward.
Clarity. Insight. Action—all from a single chart.


